
Clean energy and cooking
Installation, use and repair of solar lights, pumps and improved cookstoves, measured months after handover, not only on distribution day.
The human side of climate programmes, measured household by household
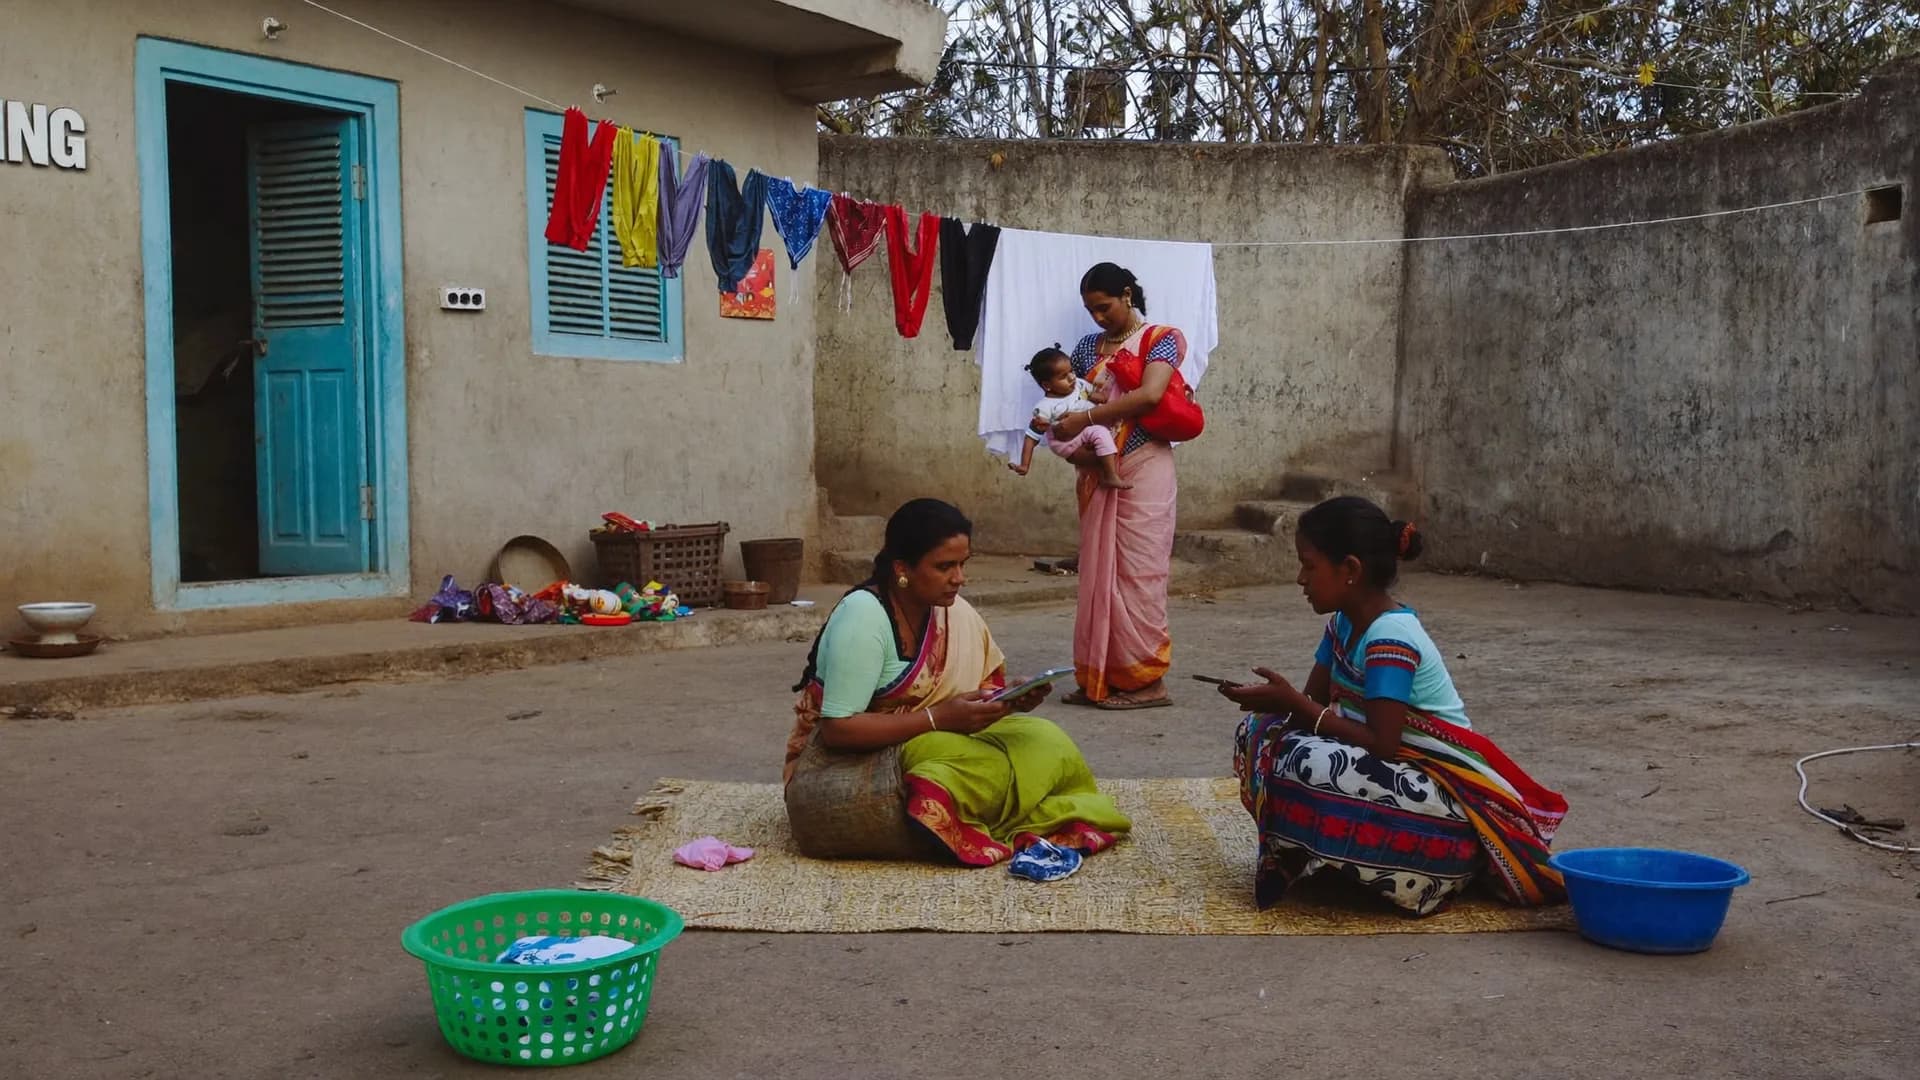
Bharat Survey is a survey agency for environment and climate change NGOs, CSR foundations and research partners. Satellite data can show a greener watershed or a hotter city. It cannot show whether a family's income recovered, whether a solar pump is still working, or who stopped using a clean cookstove. We collect that evidence with GPS-verified household, farm and community surveys.
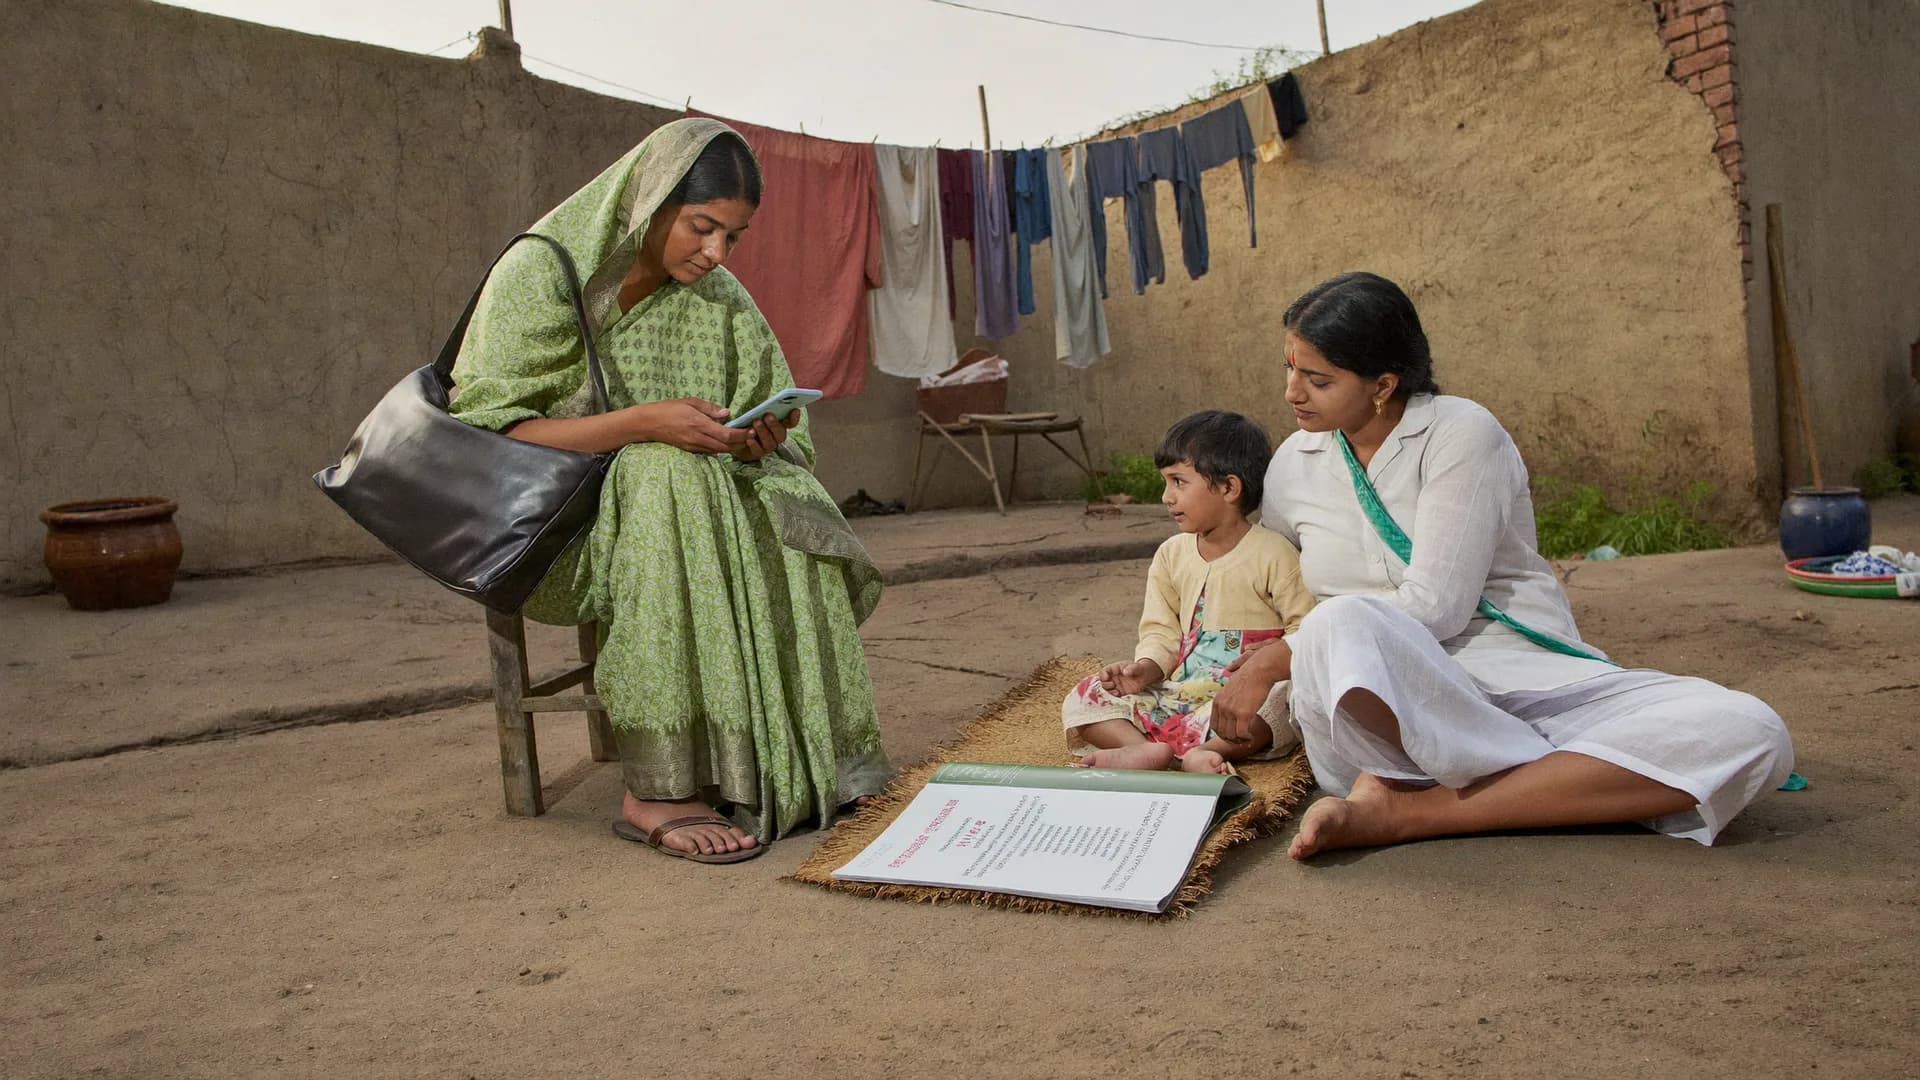
Heat that stops a construction worker at noon, a well that dries a month earlier, a cookstove abandoned because the fuel pellets never arrived. These are survey questions, and they decide whether a programme worked.
Environmental outcomes move slowly and seasonally. A baseline collected in the monsoon cannot be compared with an endline collected in summer. We lock the survey season at the design stage, geo-tag every plot, structure and household so the same units can be revisited, and pair self-reported outcomes with simple observations such as whether a pump runs when switched on.
Many CSR-funded environmental projects feed into company sustainability disclosures. SEBI's Business Responsibility and Sustainability Report format asks listed companies to report on environmental and social parameters. Field evidence from community programmes helps those disclosures rest on verified records rather than activity counts.
Scheduled revisits to a random sample of beneficiaries to check whether assets still work and are still used, with reasons for abandonment recorded.
Field staff record structures, plantations and household visits offline with GPS and photos, and supervisors see coverage on a map when data syncs.
Outcome comparison between programme and similar non-programme villages, surveyed in the same season with the same tools.
| Question | Household survey | Remote sensing |
|---|---|---|
| Did green cover increase? | Limited | Strong |
| Did household income recover? | Strong | Not possible |
| Is the solar pump in use? | Strong, with observation | Not possible |
| Did water tables change? | Perception only | Needs hydrological data |
| Who benefited and who did not? | Strong | Not possible |
We do not provide satellite analysis ourselves; we can work alongside your remote sensing partner.
Straight answers to the questions people ask most about this topic.
Yes, through geo-tagged field visits to a sample or all sites, recording existence, condition and photos. Survival counts use an agreed method, such as counting in marked plots. This is field verification for programme reporting, not certification for carbon markets.
Yes. Forms work offline and sync later. Fieldwork in forest areas follows local permissions and seasonal access, and we plan revisits around monsoon when roads close.
Yes. Household and asset data from our surveys can feed a CSR impact assessment, and we can run the assessment itself where the scope fits. Methods, samples and limits are documented so your board and auditors can review them.
By fixing the survey season at design stage and repeating it at endline. Where seasonal variation is the question, we plan multiple rounds in the same year instead of drawing conclusions from one visit.
Share your programme sites and outcomes. We will reply with a monitoring and evaluation design.