
Bharat Surveyभारत सर्वे
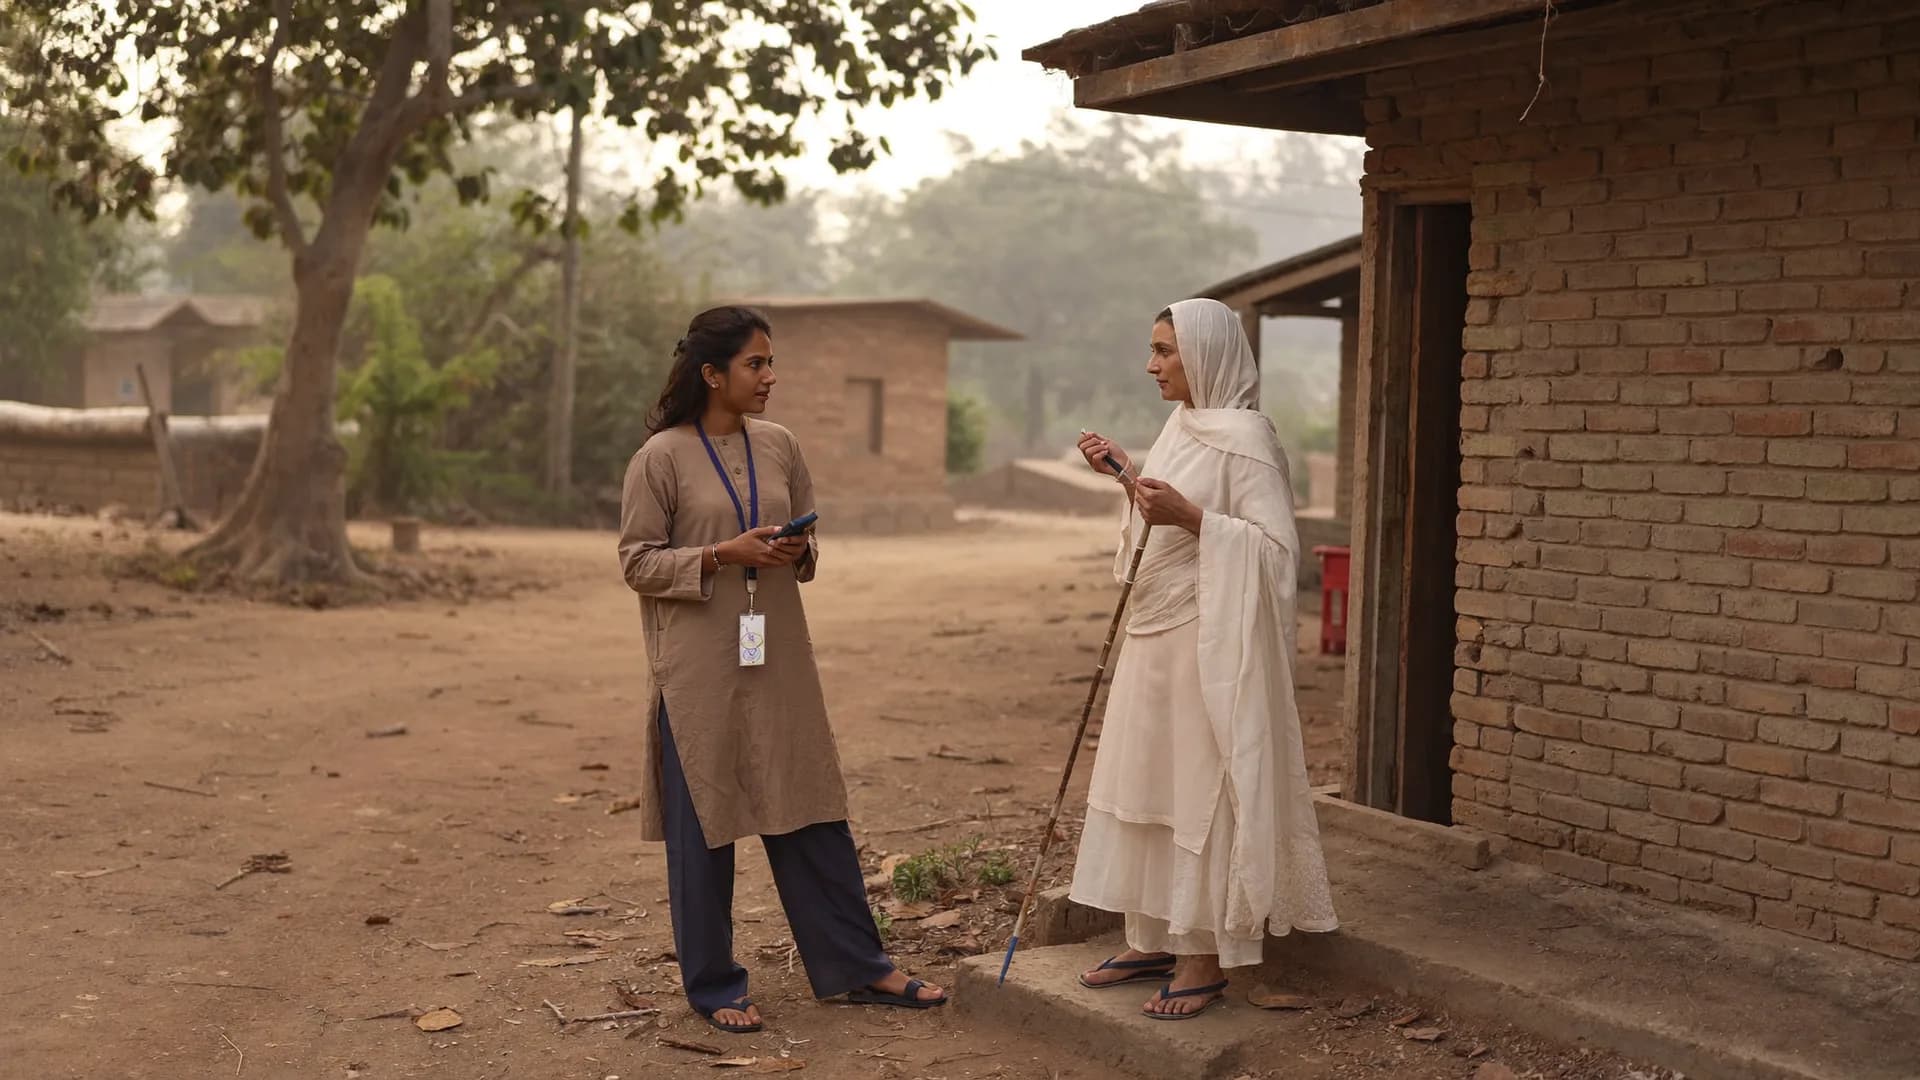
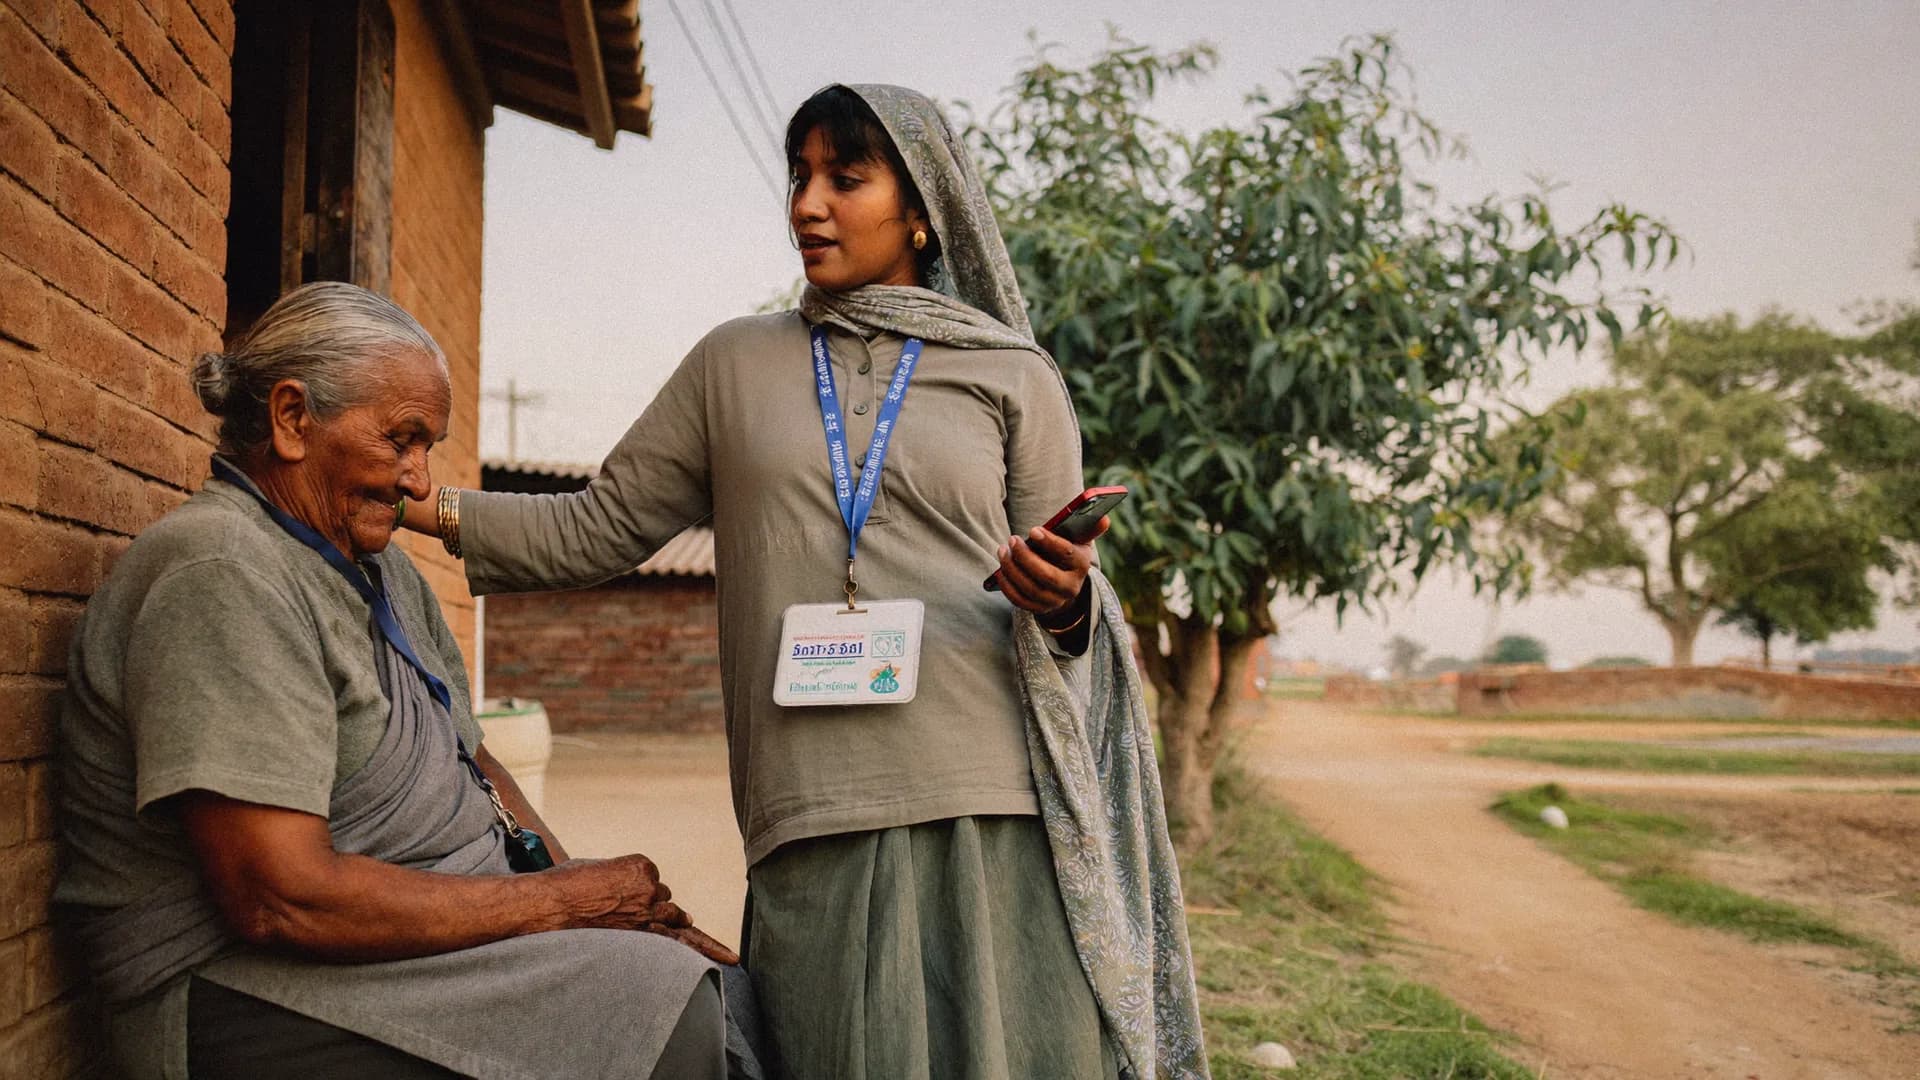
गाँव में घर के बाहर बुज़ुर्ग महिला से बात करती सर्वेयर, हाथ में फोन
Services · Election data

What happened in every polling station last time, and the time before that

Booth-wise election result analysis tells a candidate, party unit or consultant where votes actually came from. Bharat Survey takes the Form 20 result sheets published for assembly and Lok Sabha elections, turns them into clean polling-station tables, maps each booth to its village or ward, and compares two or more elections side by side. You get strong, weak and swing booths on a map, an Excel workbook you can filter, and a short PDF report that says plainly what the numbers can and cannot tell you.

  • Built only from official Form 20 result sheets
  • Booths matched across elections despite renumbering
  • Village and ward roll-ups where booths allow it
  • Excel, map and PDF report in one delivery
bharatsurvey.org/app/172/live
Ram Kumar · shift on
26.8467 N · 80.9462 E · ±12 m
14
Received
12
Accepted
1
Review
1
Outside
Constituency 172 · Survey round 2Updated 12s ago · sample
3,000
Target homes
2,184
Visits
1,962
Completed
1,871
Accepted
Daily accepted surveysLast 12 days
Quality
Accepted1871
In review64
Outside area19
Weak signal8
Top issues · by panchayat
Water62%
Roads48%
Power31%
Drains24%
Form 20 resultsPolling station-wise votesSwing boothsStrongholdsWeak boothsVillage roll-upTurnout changeMargin maps
The source

Form 20 is the final result sheet prepared at counting under Rule 56C of the Conduct of Election Rules, 1961. It lists votes for every candidate at every polling station.

After counting, the Returning Officer finalises the Form 20 result sheet for the constituency. State Chief Electoral Officer websites publish these sheets, usually as PDFs, one file per assembly constituency, for recent assembly and Lok Sabha elections. For a Lok Sabha seat, the sheets are organised by the assembly segments inside it.

Each row is one polling station: its number, the valid votes for every candidate, rejected votes, NOTA and the total. Postal ballots appear separately at the bottom. That is the whole dataset. It has no demographics and no voter names, which makes it one of the cleanest public records a campaign can study.

Why the raw PDFs are hard to use

Many sheets are scanned, some run across dozens of pages with candidate columns split between them, and polling stations are renumbered between elections when new booths are added or merged. A careless merge across two elections compares different places under the same number. Most of our effort goes into getting that matching right.

Inputs we use

  • Form 20 sheets from CEO websites
  • Polling station lists for each election
  • ECI constituency results for cross-checks
  • Delimitation order for boundary changes
  • Your own booth master, if you have one
Method

Collecting Form 20 sheets for each election
01
01 / 05

Collecting Form 20 sheets for each election

We gather the result sheets for every election in scope, record the file source and date, and check each constituency total against the published ECI result.

  • Source file logged
  • Totals cross-checked
Cleaning candidate and party columns
02
02 / 05

Cleaning candidate and party columns

Candidate names are standardised and each column is tagged with the party or independent status recorded by ECI, so the same party lines up across elections.

  • Names standardised
  • Postal votes kept separate
Matching booths across elections
03
03 / 05

Matching booths across elections

Polling stations are matched by building, locality and number, with splits and mergers recorded. Booths that cannot be matched with confidence are flagged, not guessed.

  • Split and merged booths noted
  • Unmatched booths flagged
Mapping booths to villages and wards
04
04 / 05

Mapping booths to villages and wards

Each polling station is linked to the village or ward it serves using the polling station list, so results can be rolled up to places people recognise.

  • Village and ward roll-up
  • Map layer per election
Analysis and the written report
05
05 / 05

Analysis and the written report

Strongholds, weak booths, swing booths and turnout change are calculated, mapped and explained in a short report with its limits stated.

  • Excel, maps, PDF
  • Walk-through call
What you learn

Labels only help if everyone uses them the same way. We agree the definitions with you and print them in the report.

Stronghold booths

Booths where a party or candidate led in each election studied, with a lead above a threshold you choose. These are booths to protect, not to ignore.
  • Led in every election studied
  • Lead above an agreed margin
1
2
3
4
5
6
7
8
9
10
11
12
13
14
15
16
17
18
19
20
21
22
23
24
25
26
27
28
29
30
A strongB fairC weakD very weakNo report today

Our view

Decision aid

Both are useful. The choice depends on how much the constituency has changed and what decision you are making.

Quick read

Single-election analysis

Last result, booth by booth

  • Where each candidate led last time
  • Margins and NOTA by booth
  • Village and ward roll-up
  • Good for a first look at a new seat
Deeper read

Multi-election comparison

Two or more elections matched

  • Swing booths and stable strongholds
  • Assembly vs Lok Sabha voting in the same booths
  • Turnout change over time
  • Better for planning booth priorities
Deliverables

Booth-wise result analysis: standard deliverables, September 2026
DeliverableWhat it containsFormat
Clean result workbookVotes, vote share, margin, NOTA and rejected votes per polling station, per electionExcel
Booth match sheetHow each booth maps across elections, with splits, mergers and unmatched booths flaggedExcel
Village and ward roll-upResults aggregated to village or ward where polling station lists allowExcel
Booth category listStronghold, weak and swing booths using the agreed thresholdsExcel
Result mapsBooth or village layers coloured by leader, margin and swingPDF print and interactive web map
Written reportFindings, definitions, limits and a list of booths worth a field visitPDF

The mix can be trimmed or extended on the scoping call; turnaround and price are on quotation.

Who uses it

Candidates

A clear picture of where support held and where it slipped, before booth committees are formed.

Party units

Comparable booth tables across several constituencies, built the same way.

Consultants

A clean base to join with fresh survey findings and ground reports.

Researchers and media

Polling-station data that is documented well enough to cite.

Not the right fit if

  • Predicting who will win the next election
  • Anything about how individual voters voted
  • Seats where Form 20 sheets were never published
  • Comparisons that ignore boundary changes after delimitation

A good fit if

  • Choosing which booths deserve field visits
  • Seeing assembly vs Lok Sabha differences by booth
  • Planning booth committee priorities
  • Setting a factual baseline for a new campaign
FAQ

Straight answers to the questions people ask most about this topic.

What is Form 20 in an election?

Form 20 is the final result sheet prepared by the Returning Officer at counting, under Rule 56C of the Conduct of Election Rules, 1961. It shows the votes each candidate received at every polling station in the constituency, plus postal ballots, rejected votes and NOTA. State CEO websites publish these sheets after the election.

Can you compare results when booth numbers changed?

Yes, with care. Polling stations are added, split and merged between elections, so numbers alone are not reliable. We match booths by building and locality from the polling station lists, record splits and mergers in a match sheet, and flag any booth we cannot match with confidence instead of forcing a pair.

Do you analyse local body elections too?

Where the State Election Commission publishes booth-level or ward-level results for panchayat or municipal elections, we can include them. Publication varies by state and by election, so we confirm what exists for your area on the scoping call before quoting.

How are swing booths defined?

We agree the definition with you before counting. A common version is a booth where the leading party changed between two elections, or where the margin moved by more than a set number of percentage points. The definition and threshold are printed in the report so the list can be checked.

Does booth-wise analysis show how a family or community voted?

No. Form 20 reports votes per polling station, each covering anything from a few hundred to over a thousand electors. It cannot show how any person, household or community voted, and our reports do not claim to. For reasons behind a shift, a field survey with consent is the right tool.

How long does it take and what does it cost?

It depends on the number of constituencies and elections, the quality of the source PDFs and whether you want maps and a written report. We scope it on a call and send a quotation with a delivery date. There is no fixed price list.

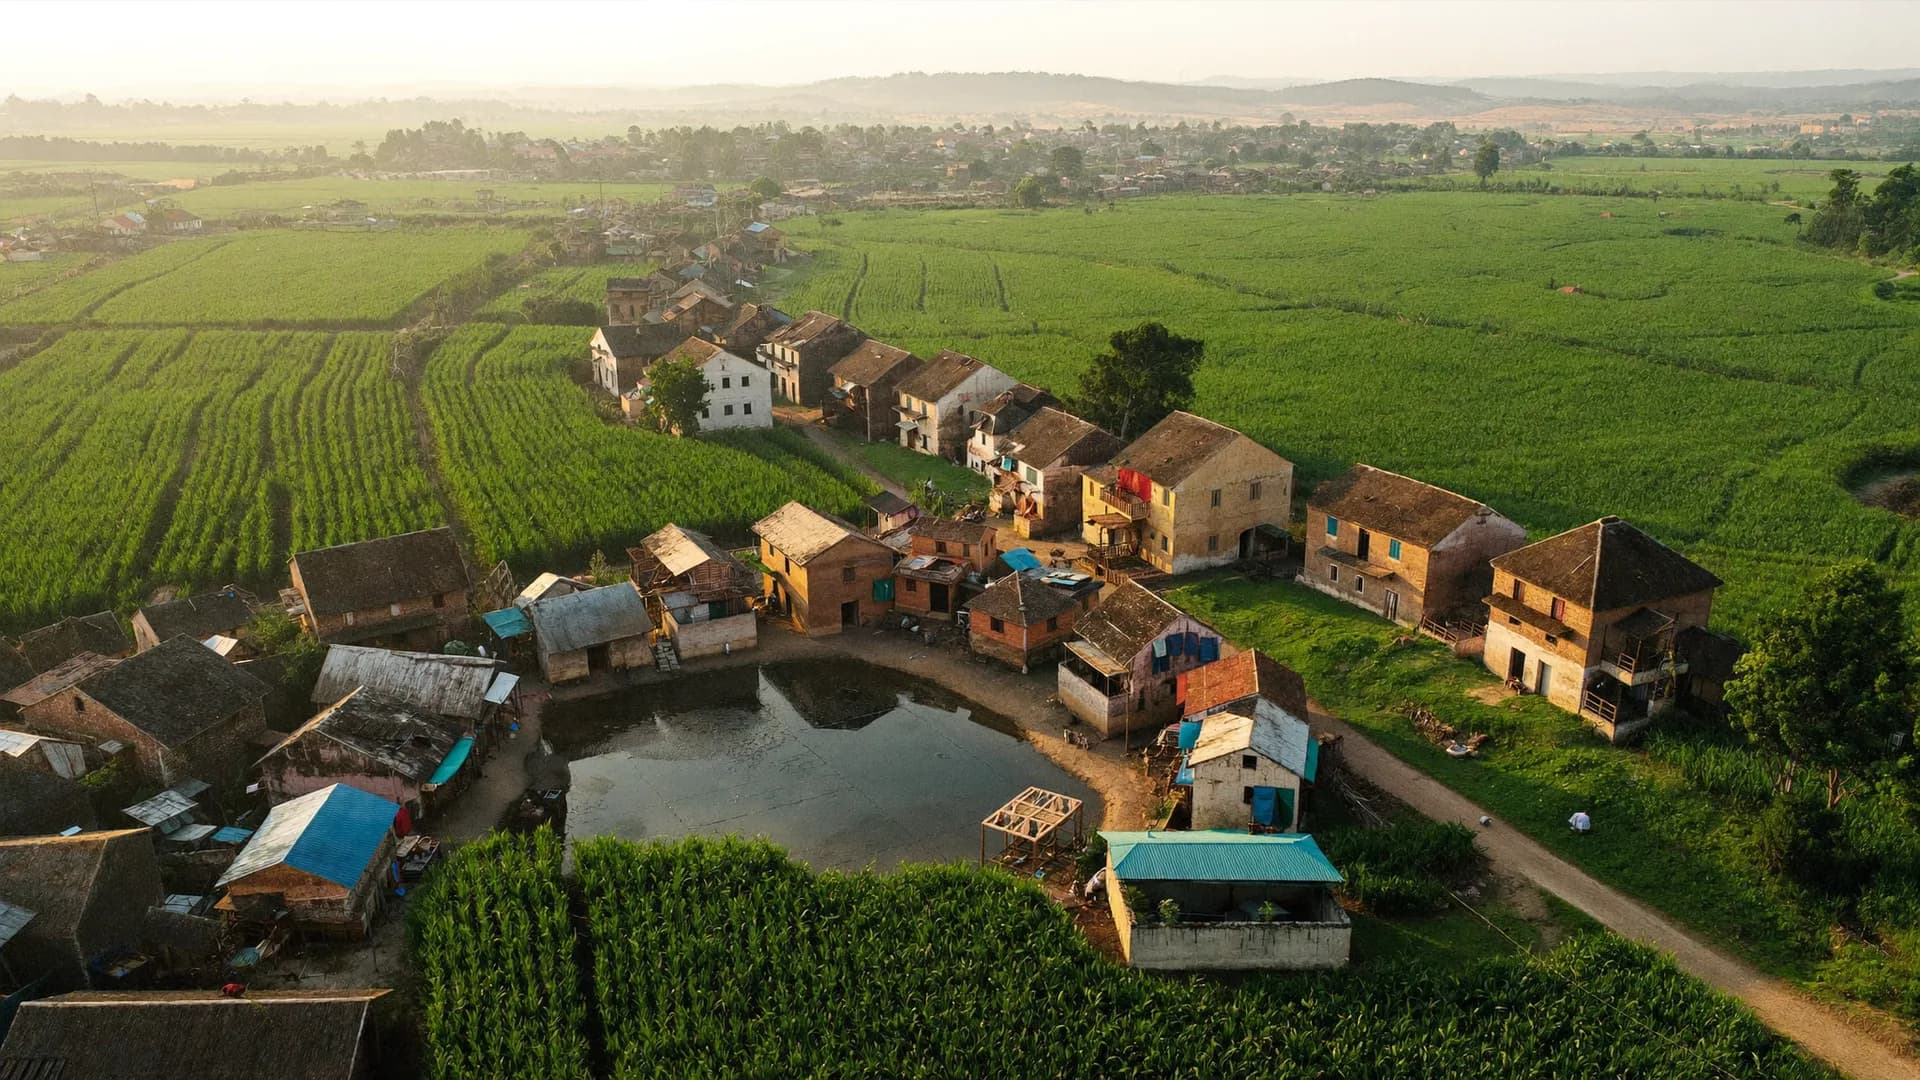
शाम के समय कस्बे का हवाई दृश्य
India Nationwide, Hindi-first

Tell us the constituency and which elections to compare. We will check that Form 20 sheets exist, confirm the deliverables and send a quotation.