Bharat Surveyभारत सर्वे
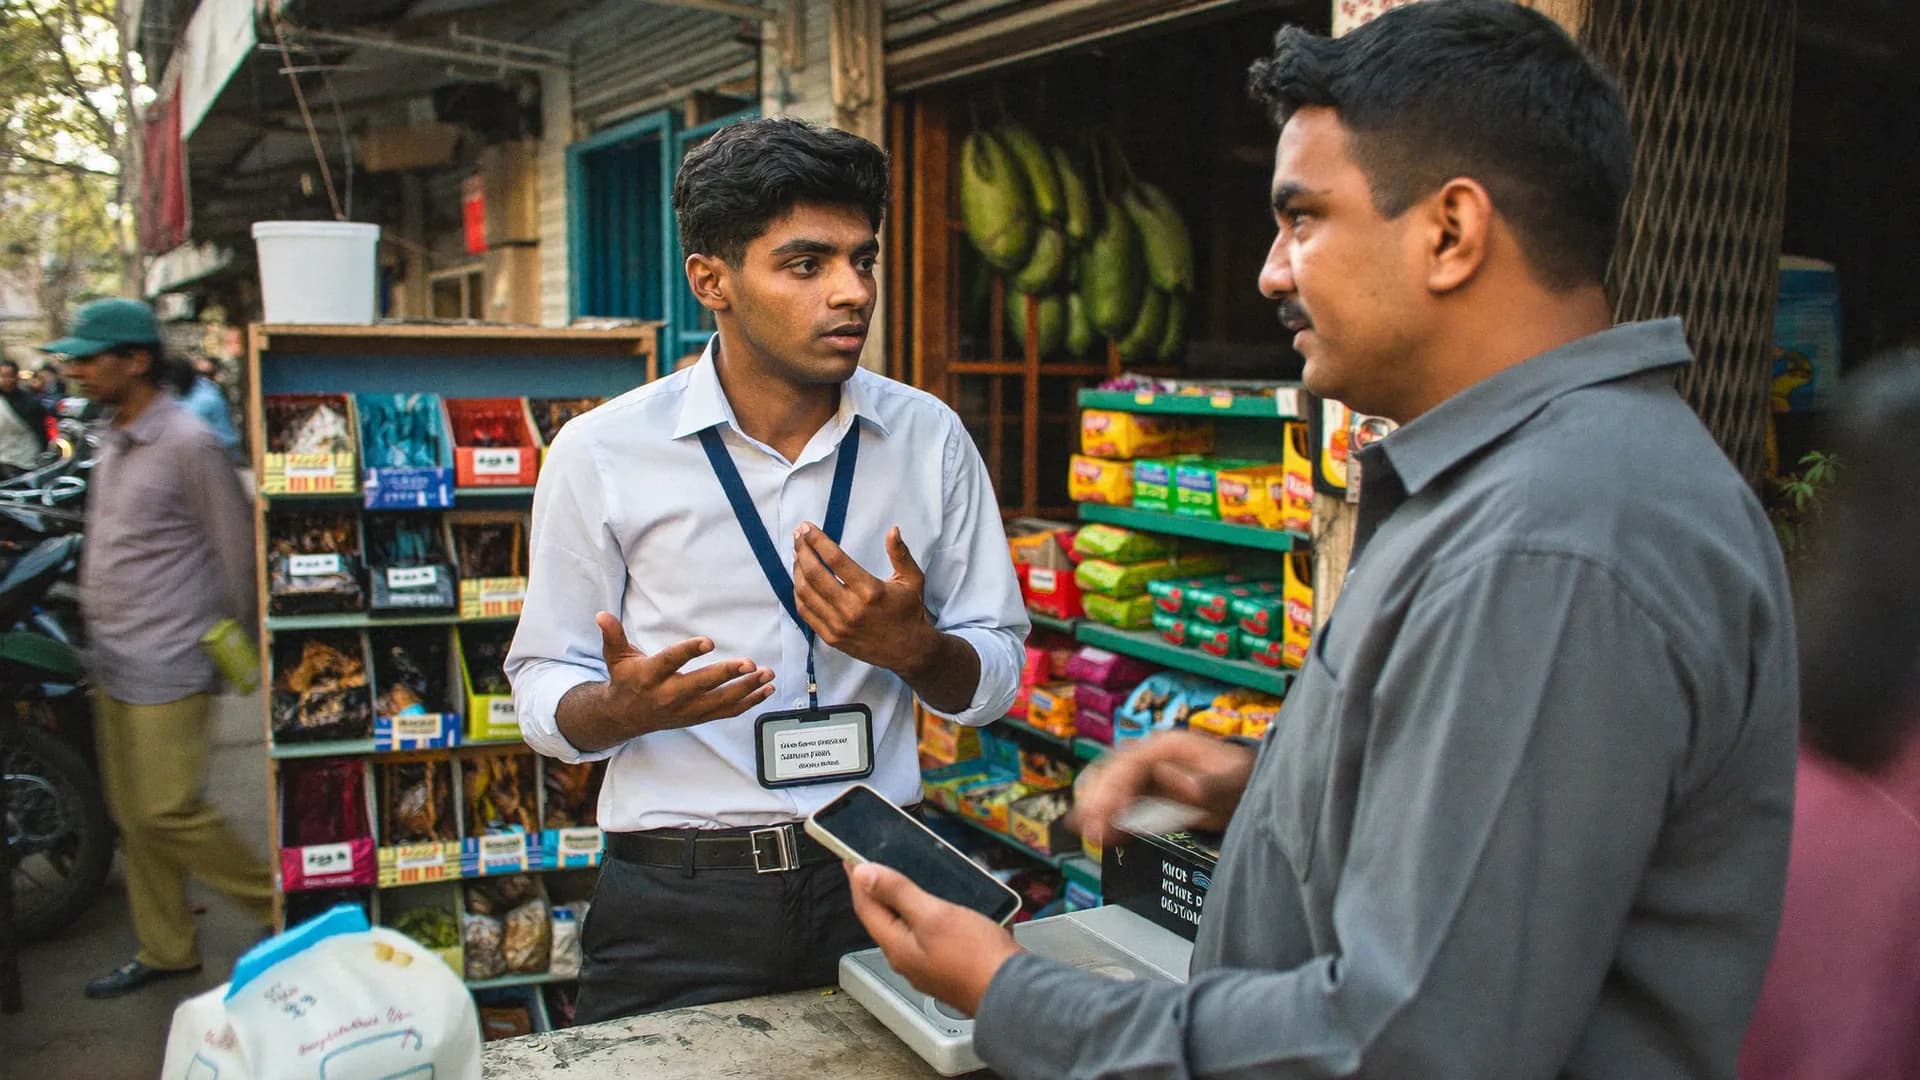
थोक बाज़ार में डिस्ट्रीब्यूटर विज़िट दर्ज करता फील्ड अधिकारी
Services · Retail site research

Counts, intercepts and catchment maps before you sign a lease

Bharat Survey is a footfall count survey agency in India for retail chains, QSR brands, banks, pharmacies, showrooms and property teams deciding where to open next. Trained counters record passers-by and entries at candidate sites in fixed time blocks, interviewers ask shoppers where they came from and what they buy, and we turn both into a catchment map and a plain site comparison.

  • Manual counts in 15-minute blocks, weekday and weekend
  • Customer intercepts on origin, spend and competitors
  • Catchment maps from shopper origin points
  • Side-by-side comparison of candidate sites
Footfall count survey agency India
Retail audit · Wave 3 · 1,200 outletsUpdated 12s ago · sample
3,000
Target outlets
2,184
Visited
1,962
Audited
1,871
Accepted
Daily accepted auditsLast 12 days
Quality
Accepted1871
In review64
Outside area19
Weak signal8
Top gaps · by territory
Out of stock62%
Planogram48%
Price label31%
Visibility24%
Manual footfall countsPasser-by and entry countsShopper interceptsCatchment mappingCompetitor store mappingWeekday vs weekendSite feasibilityTrade area analysis
Why people still count by hand

Camera counters are excellent inside a store you already run. For a site you have not leased yet, there is nowhere to mount them. That is where trained people with a clear protocol still do the job.

A counter stands at a fixed point with a defined line on the pavement or mall corridor and records people crossing it, split by direction and, where needed, by apparent group such as adult, family or two-wheeler rider. Counts are entered into the app in 15-minute blocks, each block stamped with time and GPS, so a supervisor can see at once if a counter left the post or stopped recording.

We count the same sites on matched days and hours, usually including a weekday, a weekend day and a known peak such as a salary week or festival period if the decision depends on it. Counting one Saturday afternoon and calling it footfall is the most common mistake in site selection.

What we count

The unit depends on the question. A pharmacy wants pedestrian passers-by on its side of the road. A car showroom wants vehicles slowing near the frontage. A mall anchor wants corridor traffic by level. We agree the unit and the counting line before fieldwork, and photograph each line for the report.

Count sheet fields

  • Site ID and counting line photo
  • Time block start and end
  • Direction of movement
  • Passers-by and entries
  • Group type where agreed
  • Weather or event notes
Study components

Counts alone rarely decide a site. These components are combined based on what you need to know.

Count

Retail audit and footfall study at existing outlets

At your current stores, we pair entry counts with a short outlet audit of visibility, signage, stock presence and queue times, so you can compare conversion across outlets.

  • Entry counts by hour
  • Outlet checklist with photos
  • Conversion with your billing data
Survey 5/6 · Photo
Photo of a public issue
Camera · no faces
5 MB → 210 KB · with location/time
SkipTake photo
Talk

Exit interview survey mall shoppers answer in two minutes

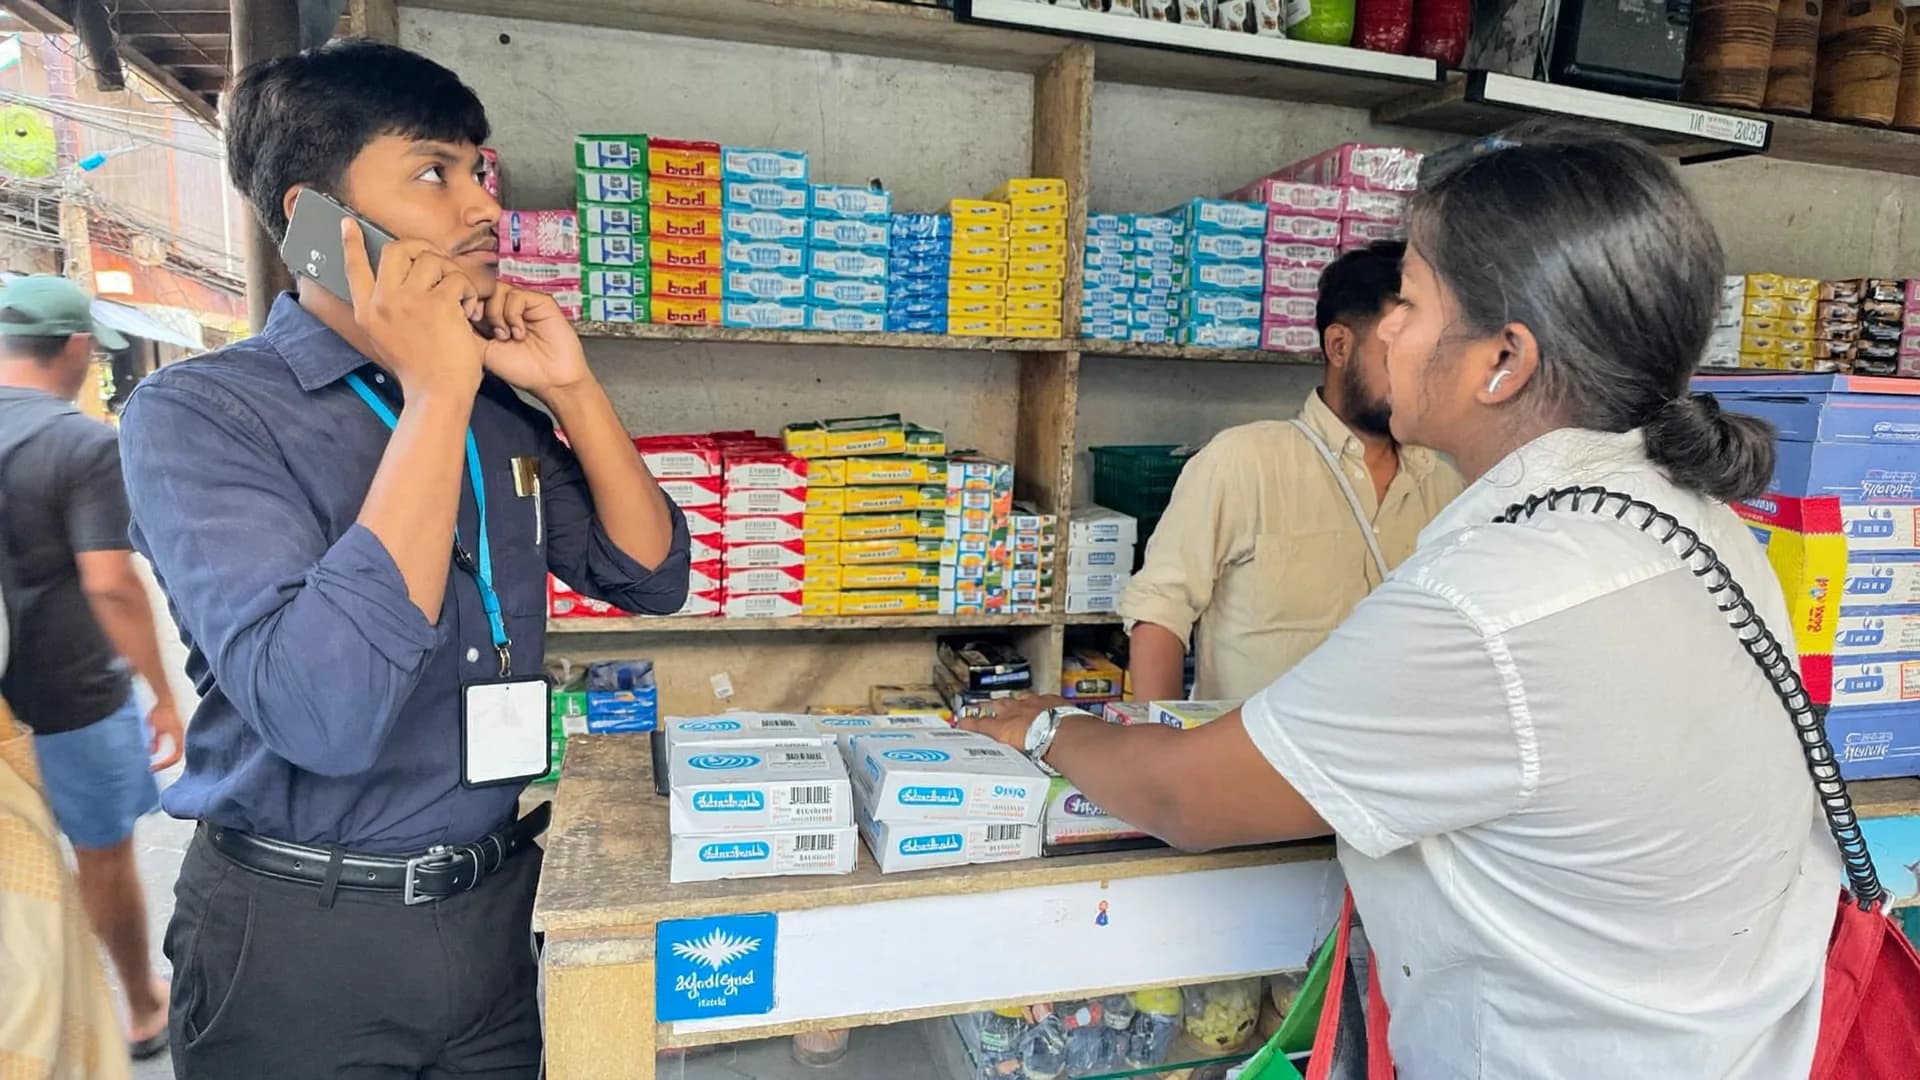
Interviewers approach shoppers leaving a mall, market or competitor store at a fixed interval and ask where they came from, how they travelled, what they bought and where else they shop.

  • Origin locality or pin code
  • Travel mode and time
  • Spend band and categories
Survey 3/6 · AmenitiesOffline
How is drinking water in your area?
  • Comes regularly
  • Comes sometimes
  • Rarely / never
  • Don't know
✓ Section saved on phone · autosave
BackNext
Profile

Shopper profiling study India retailers use for format decisions

Age band, household type, occupation and shopping habits of people already in the area, so format, range and pricing can be matched to who actually shops there.

  • Demographic mix
  • Shopping frequency
  • Brand and channel use
Retail audit · Wave 3 · 1,200 outletsUpdated 12s ago · sample
3,000
Target outlets
2,184
Visited
1,962
Audited
1,871
Accepted
Daily accepted auditsLast 12 days
Map

Competitor and anchor mapping

Field teams geo-tag competitor stores, anchors, parking, bus stops and other traffic generators around each candidate site.

  • GPS-tagged points
  • Photos of frontage
  • Opening hours noted
bharatsurvey.org/app/172/live
Ram Kumar · shift on
26.8467 N · 80.9462 E · ±12 m
14
Received
12
Accepted
1
Review
1
Outside
From dots to a boundary

A trade area is drawn from where shoppers actually come from, not from a fixed radius. Each intercept records an origin locality or pin code. We plot those origins, then mark the primary trade area as the zone producing most shoppers and a secondary zone for the next band. Roads, rivers, railway lines and flyovers usually bend these zones far away from neat circles.

We then layer publicly available population data from Census 2011 for the localities inside each zone, noting clearly that the census is dated and that fast-growing suburbs will be undercounted.

Trade area outputs

  • Origin point map
  • Primary and secondary zones
  • Travel mode split
  • Competitor locations inside each zone
  • Population notes with sources

Our view on site selection

Comparing candidate sites

A worked template of the site sheet we deliver. The values shown here describe what is measured, not results from any real site.

Measures used to compare candidate retail sites
MeasureHow it is collectedWhy it matters
Weekday and weekend passers-byManual counts in 15-minute blocksBase traffic and its peaks
Entry rate at comparable stores nearbyEntry counts at an agreed competitor or anchorRealistic conversion from traffic
Share of shoppers from the primary zoneIntercept origin pointsHow local the demand is
Travel mode splitIntercept questionsParking and access needs
Competitor count inside the trade areaGeo-tagged mappingPressure on share
Visibility and access scoreStructured site checklist with photosFrontage, turns, crossings
Feasibility

01

Market feasibility study for new store sites

Agree the format, target shopper and the two to six candidate sites. Fix counting lines, days and intercept questions.
Week 1
02

Counts and mapping

Counters work matched time blocks at each site. Mappers geo-tag competitors and traffic generators.
Week 2
03

Intercepts

Interviewers run short shopper intercepts at the site, nearby anchors and competitor exits.
Weeks 2–3
04

Site sheet and read-out

One comparison sheet per site, trade area maps and a short read-out for the expansion committee.
Week 4
Talking to shoppers

Permission first

Access
Malls and private complexes need management permission for intercepts. We seek it in writing or move interviews to public space nearby.

Fixed interval selection

Sampling
Interviewers approach every nth shopper leaving, rather than whoever looks friendly, and log refusals.

Two to four minutes

Length
Short forms keep refusals low. Longer shopper studies are scheduled as separate sit-down interviews.

No personal contact data by default

Privacy
We record locality or pin code, not addresses or phone numbers, unless a follow-up study is agreed and consent is taken.

Not the right fit if

  • You need continuous 24x7 counts inside stores you already run: use sensors or cameras
  • You want mobile location data analytics
  • You need a formal property valuation
  • You want results from a single afternoon's count

A good fit if

  • Choosing between candidate sites before leasing
  • Checking a broker's footfall claims
  • Understanding who shops in a new city or town
  • Comparing outlet performance with audits and counts
FAQ

Straight answers to the questions people ask most about this topic.

Footfall survey cost India?

Pricing is on quotation because it depends on the number of sites, counting hours per site, how many days are counted, whether intercepts and competitor mapping are included, and the cities involved. Send the site list and the decision you need to make, and we will scope the minimum study that answers it.

How to do catchment area analysis?

Interview shoppers at or near the site and record where each came from, by locality or pin code. Plot those origins, mark the zone producing most shoppers as the primary area and the next band as secondary, then add population data, competitors and access barriers such as highways or rail lines. Avoid fixed-radius circles.

How many days should footfall be counted?

At least one representative weekday and one weekend day at matched hours, with a peak period added if the decision depends on it. Single-day counts are sensitive to weather, events and local holidays, and can mislead.

Can you count vehicles as well as pedestrians?

Yes. Counters can record vehicles by type passing or turning near a site, which matters for showrooms, fuel-adjacent retail and drive-through formats. The counting unit is agreed before fieldwork.

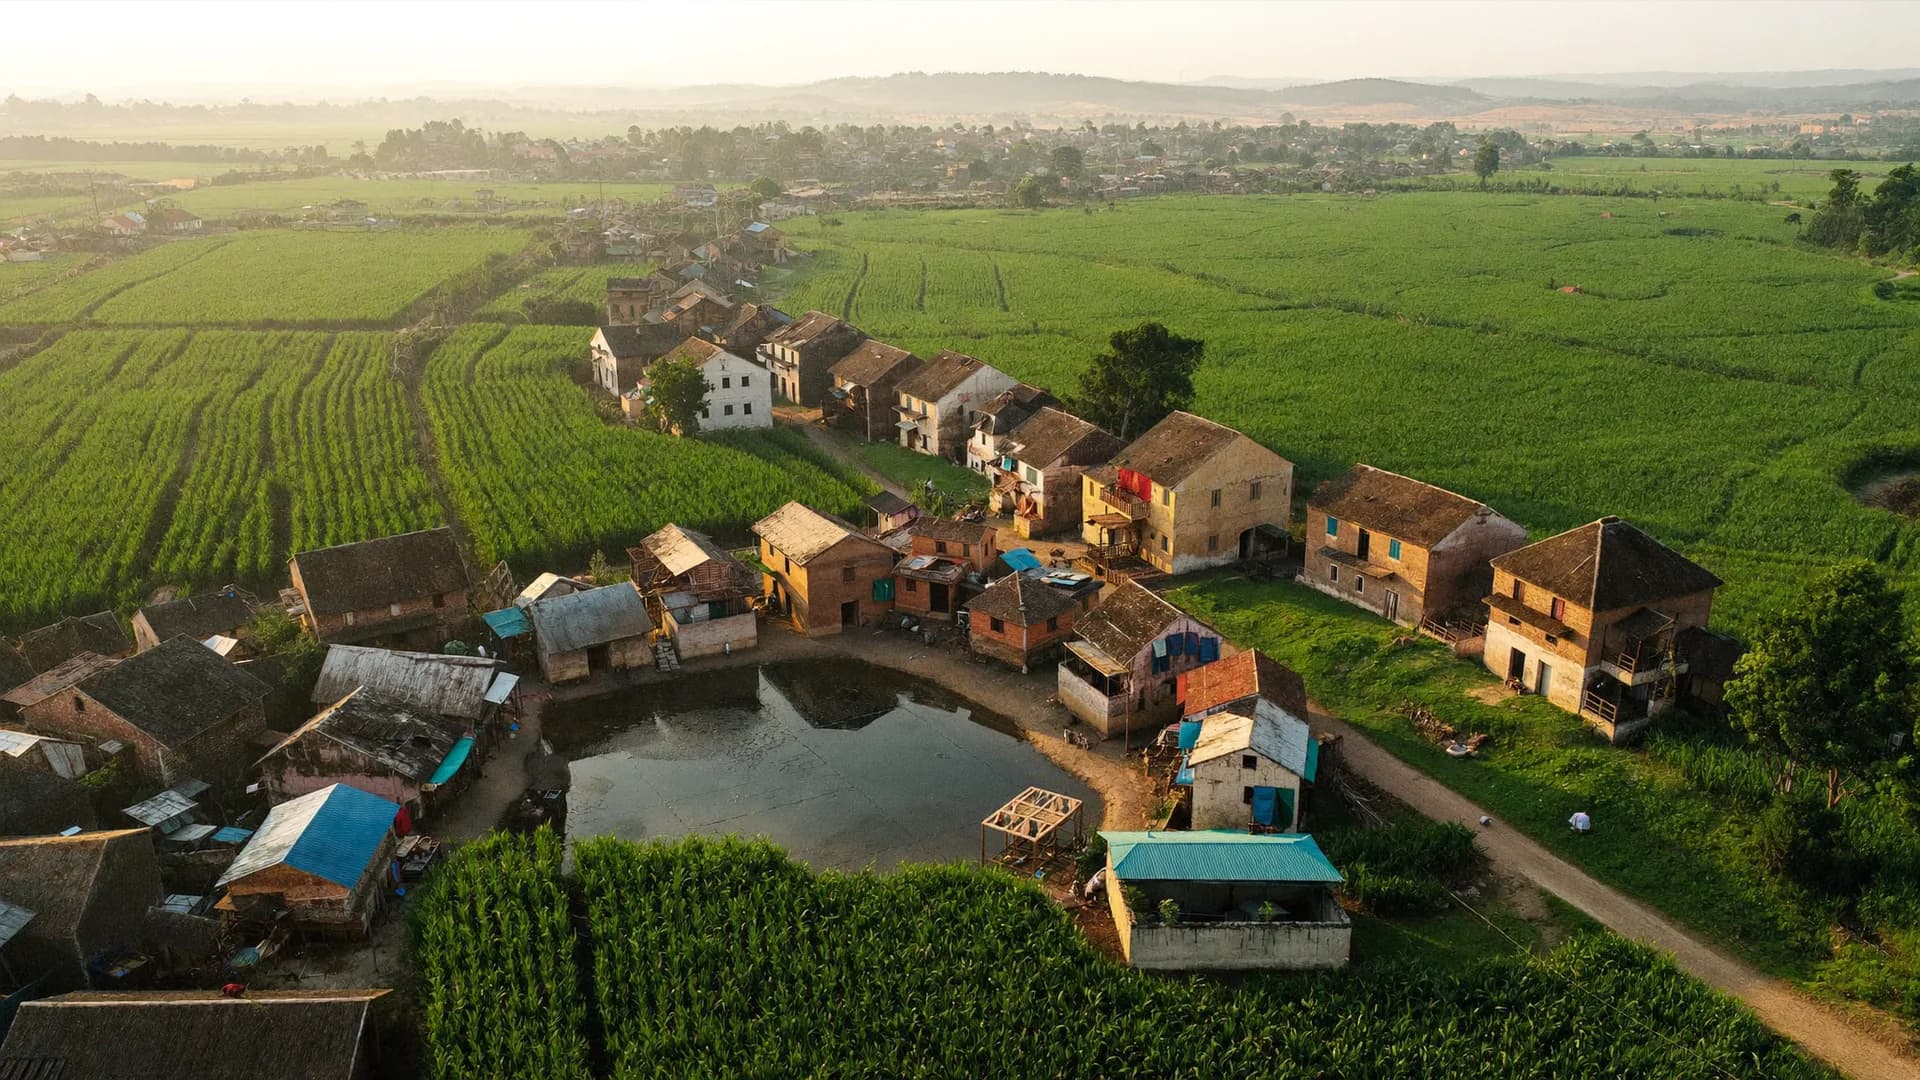
शाम के समय कस्बे का हवाई दृश्य
India Nationwide, Hindi-first

Send the format, the city and the candidate addresses. We will propose counting days, intercept questions and a comparison sheet.