
A ratio is only as honest as the field data and discounts behind it
Social return on investment (SROI) in India has become a common ask in CSR impact assessment requests, and a common source of inflated numbers. Bharat Survey helps CSR teams, foundations and NGOs build SROI analyses on real stakeholder evidence: we map outcomes with beneficiaries, measure them through GPS-verified field surveys, apply deadweight, attribution, displacement and drop-off openly, and show every assumption so your board can challenge it.
- Outcomes defined with stakeholders
- Field surveys to measure change
- Deductions shown, not buried
- Sensitivity analysis on every ratio
SROI is a framework for valuing the outcomes a programme creates for the people it affects, expressed in money terms and compared with the investment. Its principles, published by Social Value International, start with involving stakeholders, understanding what changes, valuing what matters, including only what is material, not over-claiming, being transparent and verifying the result.
An SROI ratio of 3:1 means the analysis estimates about three rupees of social value for each rupee invested, after deductions. It is not cash returned, and ratios from different programmes are rarely comparable because proxies and boundaries differ. The value of an SROI is in the story of change and the evidence behind it; the ratio is a summary, not the finding.
Two kinds of SROI
- Evaluative: based on outcomes that already happened
- Forecast: predicts value if outcomes are achieved
- Evaluative needs field data
- Forecast needs clear assumptions
Field evidence first, spreadsheet second
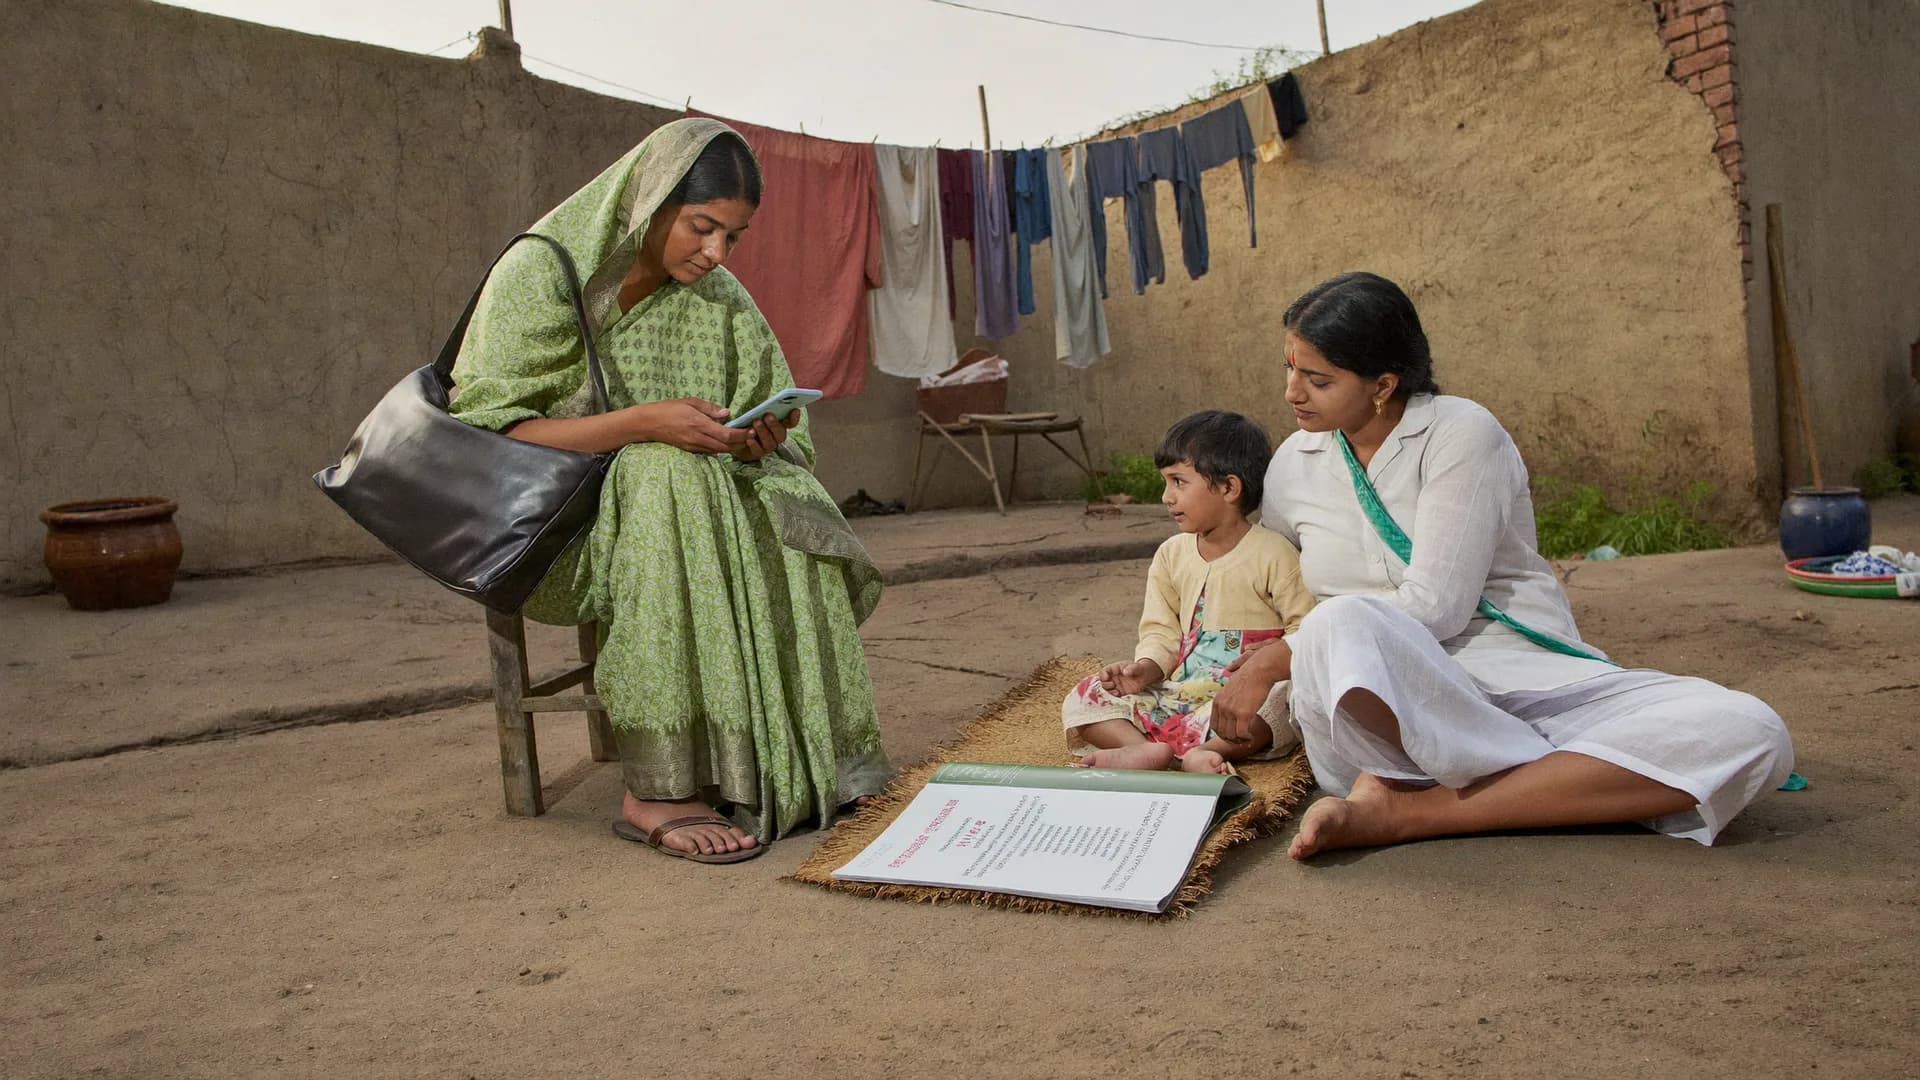
Most weak SROI reports skip the field. Outcomes are assumed from programme targets, quantities come from MIS, and proxies do the rest. We go to beneficiaries and a comparison group, ask what changed, how much, for how long, and what else contributed.
Six stages, following the standard SROI approach, adapted to Indian CSR reporting.
Set scope and stakeholders
Map outcomes
Evidence outcomes
Value outcomes
Apply deductions
Calculate and test
These four deductions are where most over-claiming hides. We estimate each from data where possible and state it plainly where we cannot.
Would it have happened anyway?
Who else contributed?
Did it just move the problem?
How fast does it fade?
Our stance
Proxies should reflect Indian prices and wages, not imported values. These are illustrations of the type of source, not fixed values.
| Outcome | Possible proxy | Type of Indian source |
|---|---|---|
| Increased household income from livelihood training | Change in annual earnings | Beneficiary survey vs comparison group |
| Reduced time spent fetching water | Hours saved valued at local wage | Time-use questions; state minimum wage notifications |
| Avoided out-of-pocket health spending | Average cost of treatment avoided | NSS health expenditure reports; facility tariffs |
| Girls continuing secondary school | Lifetime earnings gain of an extra year | PLFS wage data by education level |
| Improved confidence or wellbeing | Stakeholder valuation | Willingness-to-pay or choice exercises in the field |
Every proxy used in a report is listed with its source and year, so it can be replaced if the reader disagrees.
Not the right fit if
- Programmes under a year old with no outcome data
- Comparing ratios across unrelated programmes
- Marketing claims without a sensitivity range
- Replacing the Rule 8 impact assessment report itself
A good fit if
- Mature CSR programmes with reachable beneficiaries
- Boards wanting value per rupee with visible assumptions
- NGOs making a funding case with evidence
- Studies combined with a CSR impact assessment
NGO and CSR solutions
Survey software and evaluation services for NGOs and CSR.
Learn moreMonitoring and evaluation
Ongoing M&E systems and periodic evaluations.
Learn moreImpact evaluation
Comparison-group studies that feed attribution.
Learn moreNGO data collection app
Offline beneficiary surveys on Android.
Learn moreNGO M&E software
Track indicators and outcomes over time.
Learn moreStraight answers to the questions people ask most about this topic.
What is a good SROI ratio?
There is no universal good ratio. A ratio depends on proxies, boundaries and deductions, so two programmes can't be ranked by ratio alone. A credible report shows a range from sensitivity analysis and explains which assumptions drive it. Anything above 1:1 with transparent deductions is a meaningful result.
Is SROI required under CSR rules?
No. The Companies (CSR Policy) Rules require impact assessment for certain companies and projects, but do not prescribe SROI. Some companies choose SROI as one part of their impact assessment to express value in money terms.
How long does an SROI study take?
An evaluative SROI with a field survey usually takes about two months: scoping and outcome mapping, fieldwork with beneficiaries and a comparison group, valuation, deductions and sensitivity testing. Larger multi-state programmes take longer.
Can you do an SROI without a comparison group?
Yes, but deadweight then relies on stakeholder estimates or secondary data, which is weaker. We state that limitation in the report and widen the sensitivity range accordingly.

Share the programme, years running and beneficiary numbers. We will suggest scope, survey design and timeline.